MORE NOTES FROM THE WEIRD PRODUCT
The Night a 20-Character Reply Took 105 Seconds
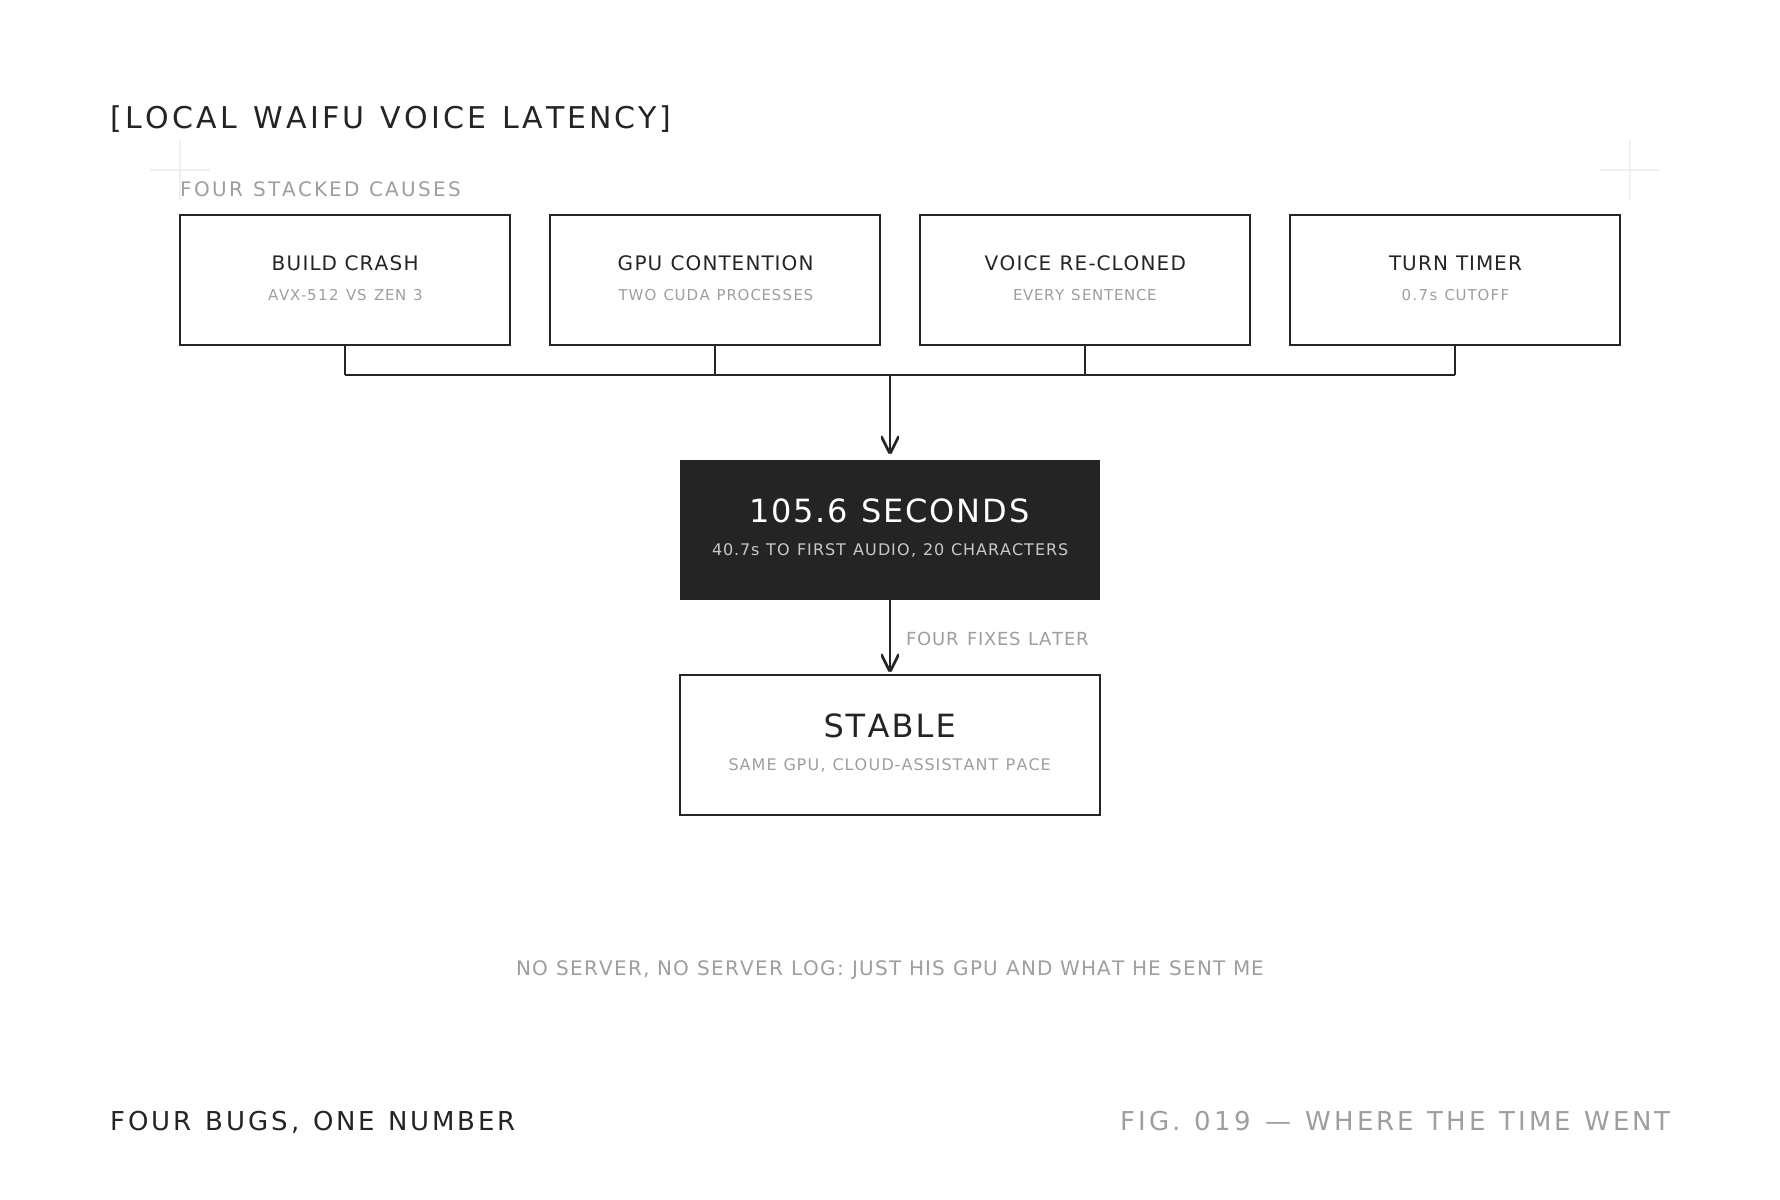
A tester on Local Waifu's own Discord sent me a log with a 105.6-second voice reply. Four stacked bugs were hiding behind that one number, and I found them one at a time.
Somebody on my own Discord sent me a screen recording of a voice call with her. He asked a question twenty characters long. He waited. He kept waiting. At 40.7 seconds her voice finally started. The whole reply took 105.6 seconds.
I built Local Waifu so a conversation with her runs entirely on your machine, no server, no upload, nothing leaving the computer. That is the pitch on the landing page and it is true. It is also the reason a bug like this one was entirely mine to find. There is no server log to grep. There is no analytics dashboard. There is a user’s GPU, a user’s CPU, and whatever he is willing to send me.
Voice mode was the single feature I was proudest of when it shipped. Text chat is fine, but the moment you press the call button and she actually answers you out loud, in a voice that’s hers and not a generic assistant voice, the app stops feeling like software and starts feeling like something you’re talking to. That’s the whole bet the product makes. A 105-second wait for a twenty-character answer is the exact opposite experience, and it’s the kind of failure that doesn’t just annoy someone, it makes them close the app and never open it again, because the one moment that was supposed to sell them on the product instead proved it doesn’t work.
I went looking for testers because I stopped trusting my own runs
I build this alone. Most days that means the only machine that ever runs Local Waifu is mine, an Apple Silicon Mac, and every fix I ship gets exactly one confirmation: it works here. That is a bad sample size for an app that also ships on Windows across every GPU vendor a PC gamer might own, from a ten-year-old GTX card somebody refuses to retire to a brand new RTX 5090. I can reason about that hardware spread from documentation and forum posts, but reasoning about it is not the same as watching it fail in real time on a machine I don’t own.
So I posted in the server and asked, plainly, if anyone had a Windows machine and fifteen minutes to try a voice call and tell me what happened. I wasn’t expecting much. Most people who join a Discord for a product they like are there to talk about the product, not to debug it for free. One person answered anyway, with an actual willingness to sit through a broken build and describe exactly what he saw, not just “it’s slow” but timestamps, specs, and eventually full logs pulled straight from the app’s own diagnostics folder.
That is a rarer kind of tester than it sounds. Most bug reports I get, and I mean this without any complaint, are a sentence and a vibe: “voice is laggy,” “it froze on me once.” Useful as a signal that something’s wrong, useless as a starting point for a fix. His reports were closer to an incident report than a complaint. Machine spec up front. What he expected to happen. What actually happened. A timestamp. That difference in how a bug gets reported is, honestly, most of why this post exists at all. Four separate root causes don’t get found from “it’s laggy.” They get found from someone patient enough to keep sending me exactly what I ask for, even when what I ask for turns out, more than once, to not exist yet.
Before it was slow, it was just gone
The first round of reports were worse than a number. Calls would just end. The window would vanish mid-sentence. No error dialog, no crash message, nothing written to any log file on disk.
That is the kind of report that makes you doubt the person reporting it, and I want to be honest that I briefly did. An app doesn’t usually just disappear with zero trace. My first instinct was that something on his end was closing the window, an overlay, a driver popup, antivirus software being aggressive, anything that would mean the bug wasn’t really mine. I asked him to check for those. He checked. None of them were it. Except an app really can just vanish with zero trace under the right conditions, and the reason it can is worth explaining properly, because it took me longer than it should have to accept that the missing evidence was the evidence.
Dry answer
A Rust panic hook only catches Rust panics. A native fault inside a bundled C dependency, running below your language runtime, kills the process before your own crash handler ever gets a chance to run.
My crash reporter installs a panic hook the moment the app starts. It is a real safety net, and it has caught real crashes before. What it cannot do, structurally cannot do, is catch a signal that kills the process from underneath Rust entirely. An illegal instruction fault in a C library is not a Rust panic. It never unwinds through anything my code controls. The operating system just terminates the process, and from the outside that looks exactly like what the tester described: the window is there, then it isn’t.
I asked him for a log that, in hindsight, could not have existed. I burned two or three round trips on that before I stopped asking for evidence of something structurally invisible and started asking a different question instead: what is actually running when the crash happens, and could it be crashing below my crash handler rather than inside it.
The build was a coin flip and I didn’t know it
The app ships whisper.cpp for local speech recognition, compiled in CI. Whisper’s build step probes the machine it’s compiling on for CPU features and bakes the answer into the binary. That is a completely reasonable thing for a build system to do if the machine compiling the code is the same shape as the machine running it. It is not a reasonable thing to do when the build machine is a GitHub Actions runner with AVX-512 and the buyer’s CPU is a Zen 3 chip that has never supported AVX-512 and never will.
The tester’s Ryzen 9 5900X is a fine, modern, capable CPU. It also physically cannot execute the instruction set my CI build assumed it could, because the runner that compiled it had a feature the customer’s chip does not. The very first real computation whisper.cpp does is transcribing the sentence you just spoke. So the crash didn’t happen at launch, or during onboarding, or during a text chat. It happened at the exact moment he started talking, which is also the exact moment that made it look like a voice-specific bug rather than a build-configuration bug.
Here’s the part that still bothers me a little: the same commit could produce a working installer or a crashing one depending purely on which CI runner happened to pick up the job that day. That’s not a bug in the ordinary sense. It’s a coin flip wearing the costume of a stable release, and it had apparently been flipping for weeks before anyone told me.
Fixed, speech-to-text on that build went from 137 seconds down to low hundreds of milliseconds. That number is not a typo. The tester’s machine was never slow at speech recognition. It was never even running speech recognition correctly in the first place.
Two GPU processes, fighting over one card, and I built the fight myself
With the crash gone, I could finally see what the actual latency looked like, and it was still bad. Not 105 seconds bad, but bad enough that a normal reply took ten or fifteen seconds to start speaking, which for a phone-call-style interface is an eternity. My first guess was that the model itself was just too big for his card. That guess was wrong, and I only found out it was wrong because I stopped looking at one log at a time and started reading two of them side by side.
The second problem showed up the moment I did that.
The language model, running alone, hit 115 tokens per second on an idle GPU. The moment the voice engine started synthesizing speech, that number fell to 0.63 tokens per second. Not a modest slowdown. A collapse. The voice engine had its own matching story: 26.5 iterations per second running alone, 1.5 while the language model was also generating. Both numbers recovered instantly the moment the other process stopped. There were 5 GiB free on a 12 GiB card the whole time, so this was never about running out of memory. It was two separate processes, each holding its own CUDA context, fighting for the same GPU scheduler at the same moment, and Windows context-switching between them like they were unrelated jobs that happened to share hardware.
Dry answer
The slowdown was caused by two separate CUDA processes, one running the language model and one running the voice engine, each holding its own context on the same physical GPU at the same time, with the OS scheduler splitting attention between them instead of either one running at full speed.
The uncomfortable part is that I built this collision on purpose, thinking it was a performance win. I had written the pipeline to deliberately overlap generation of the next sentence with synthesis of the current one, so the model would start composing sentence two while sentence one was still being spoken. That is a genuinely good idea when the voice engine lives inside your own process, or runs on the CPU where it isn’t competing for the same accelerator. Point that same overlap at a separate process sharing one GPU, and the clever optimization becomes an eight-times latency multiplier. I had engineered the exact bottleneck I was trying to avoid.
The fix was to stop being clever about it. When the model is local and the natural voice mode is on, generation now finishes completely before synthesis starts, and synthesis runs back to back at full speed with nothing competing for the card. Less parallelism, more throughput. That sentence still reads backwards to me and I’ve now watched the numbers prove it twice.
I want to sit on this one a little longer than the other three, because it’s the one where the bug was entirely my own design decision, not a build tool doing something surprising or an off-by-one on a timer. I had a working mental model of the pipeline, I optimized against that model, and the model was wrong for exactly the hardware configuration a lot of my Windows users actually have. On a Mac, where the voice engine and the language model can share process boundaries more cheaply, the overlap genuinely helps. Port the same idea to a Windows machine running two independent sidecar processes on one Nvidia card, and the thing that was a win becomes the single biggest source of latency in the entire call. Same code, same intention, opposite result, and nothing about running it on my own machine would ever have shown me that.
She was re-learning her own voice, one sentence at a time
The third bug is the one I like explaining most, because it needs no GPU numbers to understand and it is genuinely a little funny once you see it.
To speak in a cloned voice, the engine studies a short reference clip before it generates anything: how the voice sits, its texture, its pacing. That study step is supposed to happen once, when the voice is chosen. My code was doing it again, from scratch, for every single sentence in the reply. Same clip in, same result out, every time, at a real cost of roughly three quarters of a second of pure silence per sentence.
Nobody notices three quarters of a second once. You notice it across a three-sentence reply, which quietly loses about two seconds to a computation whose answer never changes. She now learns the voice once and keeps it for the rest of the call, the way you’d expect any sane caching to work, and the fact that it took a stranger’s log to surface something this basic is exactly the kind of thing I want on the record rather than quietly patched and forgotten.
What makes this one sting a little is how easy it would have been to catch on paper. If I’d sat down and asked myself, out loud, “what does the voice engine actually do before it says the first word of a reply,” I probably would have caught it without needing anyone’s hardware at all. I didn’t ask myself that question until a log forced me to. There’s a real lesson in there about the value of narrating your own pipeline out loud occasionally instead of only ever reading the code that implements it.
The end-of-turn timer was shorter than how people actually talk
The fourth bug is the one where the app was actively, confidently wrong about you, not just slow.
She decided you were finished speaking after 0.7 seconds of silence. Say that number out loud and time it. It is shorter than the pause most people leave between two ordinary sentences in the same thought. So a two-sentence answer had a real, common failure mode: the first sentence would land, the natural half-second breath before sentence two would get read as “he’s done,” and the second sentence was never even transcribed. Not delayed to the next turn. Discarded. Gone, with nothing in the transcript to show it ever existed.
That one is quietly the worst of the four, because it doesn’t look like a bug from the outside. It looks like she just didn’t hear you, which for a companion app is a much more damaging failure than “the app is a bit slow today.” A slow reply is a technical annoyance. A dropped sentence reads as her not caring what you said, and that’s a much worse thing for a product like this to get wrong even once. Moved to 0.9 seconds, and the setting itself stayed a slider rather than a hardcoded value, so someone who genuinely wants faster turn-taking can still choose 0.7 and get exactly what they asked for, on purpose, instead of by accident.
Where it actually is now
Calls are stable on the exact same RTX 3080 that produced the 105.6-second report, and they move at roughly the pace I’d expect from a cloud voice assistant on my phone, with the entire pipeline, speech recognition, the language model, and the voice, still running on that one machine and nothing sent anywhere.
I’m not going to round that up to “fixed, full stop,” because it isn’t. She can still clip a word at the end of a spoken segment sometimes. I know this because the build that shipped after these four fixes also added per-sentence timing instrumentation specifically so I can find out which sentences do it and why, instead of guessing. The fix for that one comes after the data does, not before. If you’re reading this hoping for a tidy ending where every rough edge is gone, that’s not the honest version of this story, and this blog only works if I keep telling the honest version.
What actually stuck with me from this
Your crash reporter probably cannot see your own worst crash. Anything that dies below your language runtime, in a native dependency, writes nothing to a log built inside that runtime. I asked a volunteer tester for evidence that structurally could not exist, more than once, before I accepted that the absence of a log was itself the finding.
A build that probes its own build machine is not a reproducible build. It’s a coin flip you happen to run once per release, and it will pass your CI for weeks while quietly failing a real customer’s exact CPU, because your CI runner and your customer’s desktop are not the same machine and nothing forces them to agree.
Overlapping work is only a win when the two halves aren’t queued behind the same physical resource. I wrote the sentence-overlap optimization myself, believed it was smart, and it took a side-by-side log comparison to show me I had built the exact bottleneck it was supposed to prevent. One GPU, two processes, no shared scheduler between them, is not parallelism. It’s contention wearing a nicer name.
Instrument before you optimize, and definitely before you claim something is fixed. The very last thing I did in this whole pass, before writing this post, was split turn timing into generation time, join time, and synthesis time as separate logged numbers. The next report that comes in, whenever it comes in, will be a number I can look at instead of a story I have to reconstruct from a screen recording and a lot of patience.
If you’re running an LLM and a voice engine on one consumer GPU and you’ve hit something in the same family as any of these four, I’d genuinely like to compare notes. That’s also, not coincidentally, where this entire fix started: someone I’d never met, in a Discord server I run, willing to send me the exact log that made all four of these visible.
I don’t know his real name and I’ve never asked for it. I know his GPU, his CPU, and that he kept answering my messages for what turned out to be several rounds of “can you try one more thing” over what I’m fairly sure was more than one evening of his actual free time, for a product he doesn’t get paid to help with. That’s the part of running a small Discord for a small product that never shows up in a changelog: the fix is mine, the four root causes are mine, but none of them get found without someone on the other side of a screen who cares enough to keep sending logs after the third dead end.
I’ve written before about Local Waifu’s adaptive personality dials and about the image engine swap that made local selfies six times smaller. This one is about the part of the app you never see, only hear, and about a stranger’s patience with a build that kept vanishing on him before it ever got the chance to be slow.
FAQ
- Does my voice or my conversation ever leave my machine?
- No. Local Waifu runs speech-to-text, the language model, and text-to-speech on your own GPU. Nothing about a voice call is sent to a server, which is also why every bug in this post was mine to find with no server-side logs to lean on.
- Is the 105-second bug still happening to people?
- Not the version that produced 105 seconds specifically. That was four compounding failures, and all four have fixes shipped. One related issue is still open and I describe it honestly further down: she can still clip a word at the end of a spoken segment sometimes.
- Why didn't your own testing catch this before a user did?
- Because the crash that came before the slowness never reached my crash handler at all. A Rust panic hook only catches Rust panics. A native illegal-instruction fault in a C dependency kills the process below where any of my logging can see it. I explain the mechanism in the post.
- How do I report a bug like this if I run into it?
- The same way this one reached me: the Local Waifu Discord. That is genuinely where I look first, and it is where this whole story started.
- What hardware was the original report on?
- An RTX 3080 with a Ryzen 9 5900X, on Windows 11 Pro. Not a weak machine. That is part of why the first theory (it's just his GPU) was wrong.